
Page speed optimization is the practice of reducing load times and improving rendering efficiency so that a website delivers content to users as quickly as possible. For developers, this means optimizing server response times, minimizing asset sizes, deferring non-critical JavaScript, and improving rendering paths, with a measurable performance budget that aligns with business goals and search engine eligibility standards.
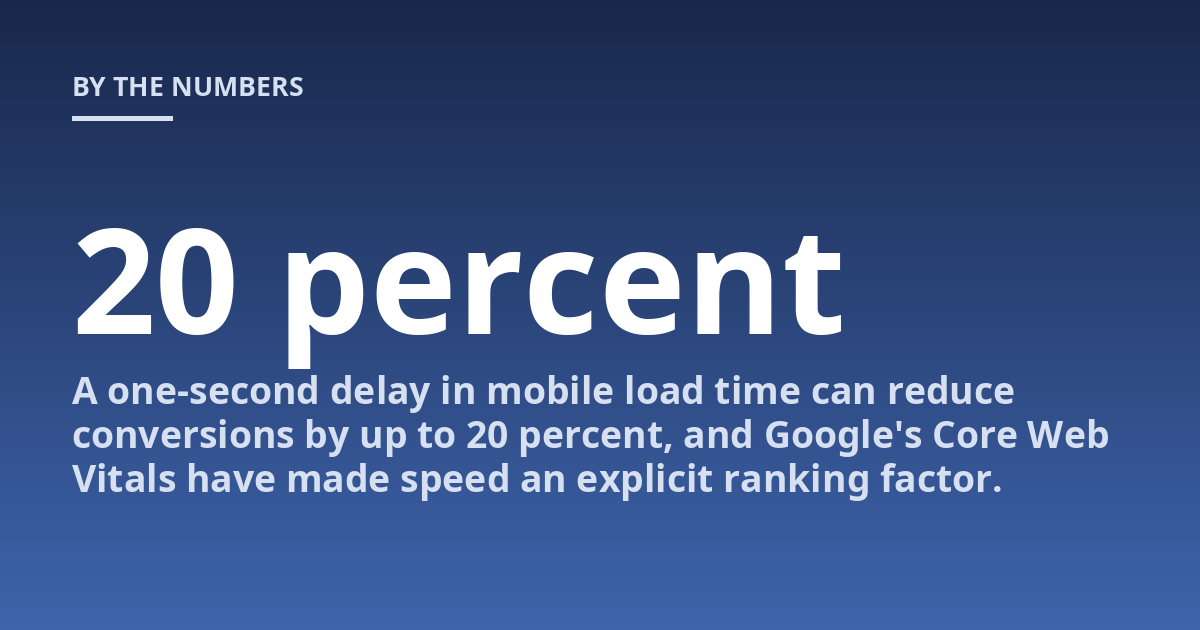
Slow pages kill conversions. A one-second delay in mobile load time can reduce conversions by up to 20 percent, and Google’s Core Web Vitals have made speed an explicit ranking factor. Yet most performance advice stays abstract: “optimize images,” “minify code,” “use a CDN.” Developers need concrete steps backed by real measurements. This guide walks through what actually works in production, with specific thresholds, tools, and decision frameworks you can apply today.
Key takeaways:
- Target a Largest Contentful Paint (LCP) under 2.5 seconds and a First Input Delay (FID) under 100 milliseconds for Core Web Vitals compliance.
- The biggest gains typically come from image optimization, server response time, and JavaScript reduction: address those first before chasing micro-optimizations.
- Use real-user monitoring tools like CrUX and Lighthouse field data, not synthetic tests alone, to measure what actual visitors experience.
- Build caching, lazy-loading, and code-splitting into your deployment pipeline so performance is maintained, not retrofitted.
What Page Speed Actually Means for Developers
Page speed is not a single number. It is a set of metrics describing different phases of the loading experience: time to first byte (TTFB), First Contentful Paint (FCP), LCP, interaction readiness (TBT/FID), and layout stability (CLS). A developer’s job is to understand which metric matters most for their specific pages and optimize accordingly.
Consider a news article page. The LCP element is typically a hero image or headline text, and CLS matters because ads in unknown positions can shift content. For a checkout form, interaction readiness trumps everything: a user cannot complete a purchase if the submit button is not responsive. The optimization strategy must match the page’s dominant use case.
From what we have seen across dozens of projects, the most common mistake is treating all pages the same. An ecommerce category page and a blog post have fundamentally different performance profiles. Developers should segment pages by template type, measure each segment’s critical path, and apply optimizations that target the bottleneck for that segment.
Core Web Vitals introduced a standardized threshold: LCP under 2.5 seconds, FID under 100 milliseconds, CLS under 0.1. These are not aspirational targets. They are the minimum bar for a good user experience. Pages falling short risk losing both visitors and search visibility.
Where to Start: The Priority Optimization Hierarchy
Apply optimizations in order of impact. Image and asset optimization comes first because it often produces the largest gains with the least engineering effort. Server-side improvements come second. JavaScript and third-party script reductions come third. This hierarchy reflects real-world experience: you can cut page weight by 60% with image compression alone, but removing 100 milliseconds from TTFB requires backend changes that take longer.
Begin with a performance audit using Lighthouse and WebPageTest for synthetic data, then pull CrUX data from Google Search Console to see what real users encounter. The gap between synthetic and field data is often revealing. A page may score 95 on Lighthouse in a lab but have a slow LCP for mobile users on 3G networks because the test environment does not throttle CPU or network realistically.
Image optimization: the first 50% gain
Images typically account for 60 to 70 percent of a page’s total weight. Serving properly sized, next-generation formats like WebP or AVIF, with responsive srcset attributes, is the single highest-impact change you can make. Implement lazy-loading for below-the-fold images using the native loading=”lazy” attribute. For critical above-the-fold images, preload them with a preconnect hint to the CDN domain.
A real-world example: an ecommerce site we worked with reduced its product page weight from 4.2 MB to 1.1 MB by converting all JPEGs to WebP at 80% quality, setting explicit width and height attributes to prevent CLS, and lazy-loading images in the carousel. LCP dropped from 4.1 seconds to 1.8 seconds. No JavaScript changes were required for that improvement.
Server response time: fixing the first bottleneck
TTFB should be under 800 milliseconds. Common causes of slow TTFB include database queries, slow application logic, inadequate caching, and DNS resolution delays. Use server-side caching (Varnish, Redis, or FastCGI cache), implement a CDN that caches HTML where possible, and optimize database queries with indexes and query result caching. If you are on shared hosting, the simplest fix is often switching to a provider with better infrastructure.
A note on CDNs: they are not a silver bullet. A CDN helps with static asset delivery and can cache full pages, but if your dynamic content requires server-side rendering for every request, the CDN only helps for TTFB if you configure edge caching. Past experience suggests most developers underconfigure HTML caching because they worry about serving stale content. Use a cache invalidation strategy based on content updates rather than caching nothing at all.
JavaScript reduction: the hard work
JavaScript is the most common cause of slow interaction readiness. Every script blocks the main thread for parsing, compiling, and execution. The approach is straightforward in theory but painful in practice: audit your third-party scripts, defer non-critical JavaScript with the defer attribute, eliminate render-blocking scripts above the fold, and implement code splitting.
The hard part is identifying what is “non-critical.” Analytics, chat widgets, social sharing buttons, and A/B testing scripts rarely need to load during initial page render. Load them after the page becomes interactive, typically by adding them as async or using a script loader that waits for the load event. The difference can be dramatic: removing two analytics scripts from the critical path on a media site cut TBT from 350 milliseconds to 90 milliseconds.
Worth noting: single-page applications and frameworks that rely heavily on JavaScript hydration (like Next.js or Nuxt with client-side rendering) have inherently higher TBT. Server-side rendering or static generation helps, but you must still measure and optimize for the client-side cost.
How to Measure What Matters
Measurement tools fall into two categories: synthetic and real-user monitoring (RUM). Synthetic tools like Lighthouse, WebPageTest, and PageSpeed Insights run a controlled test from a fixed location. RUM tools like CrUX, Sentry Performance, and custom user timing APIs capture what actual visitors experience across devices and network conditions. You need both.
Synthetic tests give you reproducible diagnostics. RUM gives you truth. A page that passes Lighthouse in a datacenter but fails in the field on mobile has a real problem, no matter what the lab score says. Pull RUM data from Google Search Console’s Core Web Vitals report, which segments pages by URL pattern and shows whether they pass or fail for each metric. If Google’s data says you have a CLS issue on 30% of page loads, believe it.
Set a performance budget. Choose thresholds for each metric, and enforce them in CI/CD. If a deployment pushes FID above 100 milliseconds for the critical user flow, the build fails. This prevents performance regressions from reaching production. Tools like Lighthouse CI and Webpack performance hints make this feasible for most teams.
One specific piece of advice: measure the same pages on both 4G throttled and fast Wi-Fi connections. What passes on a high-end laptop over fast Wi-Fi often fails on a mid-range phone over a mobile network. The CrUX dataset separates desktop and mobile, so you can see the gap.
Why Page Speed Optimization for Developers Is Especially Critical Now
Three converging trends make this the most important time to get page speed right. First, Google’s search ranking system uses Core Web Vitals as a ranking signal. Second, AI-powered search engines (AI Overviews,, Perplexity) favor content that loads quickly and is structured clearly. Third, users have become less tolerant of slow experiences: 53% of mobile visitors leave a page that takes longer than three seconds to load.
AI search engines often pull snippets or summaries from pages they can fetch and parse quickly. If your server responds slowly or your page is bloated with scripts that delay content rendering, an AI crawler may skip your content in favor of a lighter alternative. This is not speculation: Google’s SEO documentation explicitly states that page speed influences crawling budget and indexing depth.
Expert tip: In our work optimizing sites for both traditional Google search and AI engines, the pages that consistently perform best across both have one thing in common: they ship the main content as HTML in the initial server response, without waiting for JavaScript to render the text. If your key content requires JS execution to become visible, you are losing ranking eligibility in any system that cares about speed. Serve critical text in the HTML, lazy-load everything else.
For SEO practitioners and marketers reading this: page speed optimization is not a one-time technical task. It is an ongoing maintenance discipline. Budget developer time for quarterly performance audits, integrate speed checks into your deployment pipeline, and track field data month over month. The sites that invest in this discipline consistently outperform peers in search visibility, especially for competitive terms where user experience signals matter.
Common Mistakes and How to Avoid Them
The most frequent mistake is over-optimizing before measuring. Developers sometimes spend weeks implementing code splitting and tree shaking only to discover that their TTFB was the real bottleneck, or that images accounted for 80% of page weight. Measure first, identify the largest opportunities, then optimize.
A second mistake is ignoring third-party scripts. You might optimize your own code to perfection while a single analytics script or ad tag adds 400 milliseconds to FID. Tools like Request Map or Lighthouse’s third-party summary can identify the worst offenders. The solution is often to load those scripts asynchronously in a low-priority queue after the page is fully interactive.
Third is treating desktop and mobile performance as equivalent. They are not. A page that loads in 1.5 seconds on desktop may take 4 seconds on a mid-range Android phone over 4G. Always test with mobile CPU throttling and network throttling in Chrome DevTools. Better yet, use WebPageTest’s mobile test profile which simulates an actual Moto G4 on a 3G connection.
Fourth is failing to account for layout shift from dynamic content. Ads, embeds, and images without explicit dimensions cause CLS. The fix is simple: always set width and height attributes on images and video elements, reserve space for ads with fixed-size placeholders, and avoid inserting content above existing content after the initial render.
Finally, do not forget the human element. A performant page is useless if the content is not what the user needs. Speed optimization must never come at the expense of content clarity or user experience. Compress images but keep them visually acceptable. Defer scripts but ensure the page is interactive quickly enough that the user can act. The goal is a fast, usable experience, not a minimal file size.
FAQ
What is the most important thing to know about page speed optimization for developers?
The goal is to deliver a fast, stable, and interactive experience for the largest possible share of users. That requires measuring real-user data (CrUX), targeting Core Web Vitals thresholds, and prioritizing optimizations by impact: images first, server response second, JavaScript reduction third. A precise recommendation depends on your site’s specific architecture and audience.
When should page speed optimization be discussed with a professional?
A consultation is useful when you have persistent performance issues you cannot diagnose, when Core Web Vitals reports show failures you cannot fix with basic optimizations, or when your site uses complex frameworks (SPA, heavy JavaScript, custom servers) that require specialized knowledge. Early assessment can prevent a performance problem from compounding as traffic grows.
How should a developer prepare for a performance consultation or audit?
Collect current Lighthouse and CrUX reports for the most visited pages, note which metrics are failing, and list any third-party scripts, hosting infrastructure, and CMS/platform constraints. Having this information ready helps the auditor or consultant focus on the specific bottlenecks rather than spending time on discovery.
What risks or limits can page speed optimization have?
Over-optimization can reduce image quality, break functionality if scripts are deferred incorrectly, or create maintenance overhead if caching strategies are too aggressive. Performance work also takes time and developer resources. The professional leading the work should explain the tradeoffs, expected gains, and realistic timeline before starting.
What is the difference between synthetic testing and real-user monitoring?
Synthetic tests (Lighthouse, WebPageTest) run from a controlled environment and give reproducible diagnostic data. Real-user monitoring (CrUX, custom RUM) captures what actual visitors experience across device types, network conditions, and geographic locations. Both are necessary: synthetic tests help you diagnose and fix, while RUM tells you whether those fixes worked for real users.
Conclusion
Page speed optimization is a measurable, repeatable engineering discipline. Start with real user data, target the highest-impact metric for your page type, and apply fixes in priority order: images, server response, then JavaScript. Integrate performance budgets into your CI/CD pipeline and review field data quarterly to catch regressions before they affect search visibility.
The sites that invest in sustained performance optimization now are building a lasting advantage. Fast pages convert better, rank higher, and qualify for the content opportunities that AI-powered search surfaces offer. If your team needs structured guidance, a technical audit, or help integrating performance into a content strategy, consider working with a specialist who understands both the developer and SEO dimensions of the problem.
For a deeper look at measuring what search engines see on your site, read our guide on Google Search Console: A Complete Walkthrough. And if you are planning a full site review, the checklist in How to Run a Full SEO Audit Step by Step will help you frame page speed within the broader technical SEO picture.